Does RSI 30/70 reversion work in forex?
Tested on 17,629 trades across 15 instruments and 6 timeframes, with the real spread charged on every one and the last 30% of each window scored separately.
By timeframe, against a coin flip
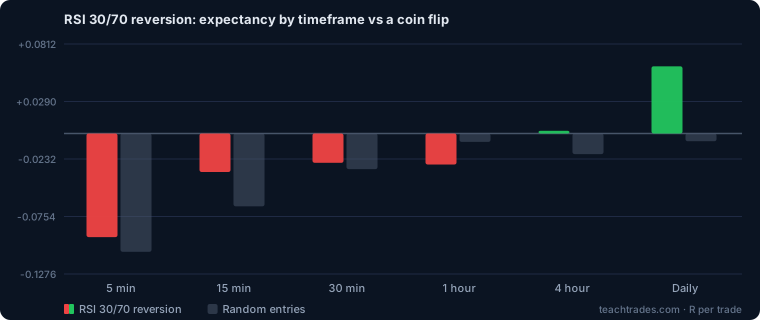
| Timeframe | Trades | RSI 30/70 reversion | Random entries | Difference | Profitable runs |
|---|---|---|---|---|---|
| 5 minute | 7,545 | -0.0941R | -0.1074R | +0.0133 | 2/15 |
| 15 minute | 2,731 | -0.0350R | -0.0661R | +0.0311 | 8/15 |
| 30 minute | 2,880 | -0.0266R | -0.0323R | +0.0057 | 7/15 |
| 1 hour | 2,795 | -0.0282R | -0.0076R | -0.0206 | 5/15 |
| 4 hour | 1,286 | +0.0024R | -0.0187R | +0.0211 | 10/15 |
| Daily | 392 | +0.0610R | -0.0070R | +0.0680 | 11/15 |
The random column is a coin flip through the identical engine — same candles, same stops, same spread. It is the only way to tell whether an indicator is contributing anything or whether you are simply watching the cost of trading. Its best timeframe here is Daily at +0.0610R.
By instrument
| Pair | Trades | Expectancy | Profitable runs |
|---|---|---|---|
| USDJPY | 1,199 | +0.0371R | 5/6 |
| AUDUSD | 1,166 | +0.0267R | 5/6 |
| GBPJPY | 1,132 | -0.0010R | 5/6 |
| GBPUSD | 1,125 | -0.0110R | 4/6 |
| EURJPY | 1,178 | -0.0205R | 3/6 |
| EURUSD | 1,157 | -0.0250R | 3/6 |
| GBPCHF | 1,180 | -0.0293R | 3/6 |
| XAUUSD | 1,161 | -0.0449R | 1/6 |
| GBPCAD | 1,154 | -0.0603R | 1/6 |
| EURAUD | 1,171 | -0.0655R | 3/6 |
| GBPAUD | 1,115 | -0.0768R | 3/6 |
| USDCHF | 1,199 | -0.0952R | 1/6 |
| NZDUSD | 1,245 | -0.1195R | 3/6 |
| AUDJPY | 1,231 | -0.1264R | 2/6 |
| USDCAD | 1,216 | -0.1686R | 1/6 |
A result that holds on one pair and collapses on the rest is not a finding, it is a coincidence with a name. Weight this table by how consistent it is, not by whichever row is highest.
How this was measured
RSI 30/70 reversion runs on its published settings, not tuned ones. Entries fill at the next bar's open, never the bar that produced the signal. The stop is four median bars wide for the timeframe and the target twice that, so the test is comparable across charts rather than measuring the stop distance. The real per-pair spread is charged on every trade.
Tuning it would produce a better number and a worse answer: the tuning would be the result. If you want to tune it yourself, the strategy tester runs the same engine on the same candles and reports the out-of-sample third separately.
Compare with
Every indicator in the study has its own page. The full table ranks all of them side by side.
The rest of the table
This indicator is one row of a larger comparison — 55 indicators, 4,950 backtests, 1,324,836 trades. The full laboratory ranks them all side by side, and explains why almost none of them beat the control on fast charts.
Want the setups, not just the maths?
Our own signals are not this - they combine several factors and decline far more setups than they take. The difference is on the public record, with the losses left in.
See today’s signals →