Do trading indicators actually work?
Every classic indicator, on its published settings, over all the history we hold — with the real spread charged on every trade, the last 30% of each window scored separately, and a coin flip run through the identical engine so there is something to measure them against.
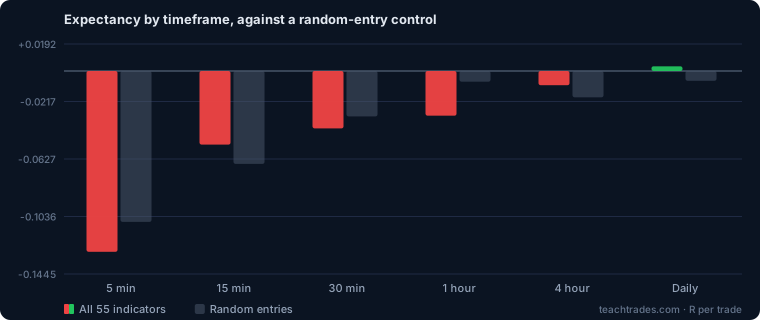
0 of 55 indicators finished with a positive expectancy when pooled across every instrument and timeframe at once, with the spread charged. On five- and fifteen-minute charts they are statistically indistinguishable from random entries run through the same engine.
That is not the same as “indicators never work”, and the table below does not say so. Pooled across everything, the fast charts dominate and nothing clears its costs. Looked at one timeframe at a time, 32 of 55 finish above zero on daily candles. Both facts come from the same rows.
The gradient people usually attribute to indicators — results improving as the chart slows — turns out to be reproduced almost exactly by random entries. It is a fact about trading costs, not about indicators. Everything below is the working.
What we actually tested
Each indicator runs on its published settings against every instrument on every timeframe, over the longest history we hold for that timeframe — five years of daily candles down to six months of five-minute ones.
The random control
We did not only test indicators. We ran a coin flip through the identical engine — same candles, same stops, same spread, same rules — and put its result in the column next to every indicator.
This is the part we would ask you to look at first, because without it none of the other numbers mean anything. If an indicator returns −0.1287R per trade, that is only informative once you know what entering at random returns on the same charts. An apparent edge that a coin flip also produces is not an edge; it is the cost of trading, or noise, wearing the name of an indicator.
It is also the strongest check available that the simulation is not cheating. A signal with no information in it should lose approximately the spread and nothing else. If random came out profitable, the engine would be reading the future and every other figure here would be worthless.
The results
Every indicator, pooled by timeframe, against the control. Nothing else changes between these rows — same indicators, same instruments, same rules. Why random? If an indicator carries useful information it should beat an entry that carries none. The control is that entry.
| Timeframe | Trades | All 55 indicators | Random entries | Difference | Runs profitable |
|---|---|---|---|---|---|
| 5 min | 540,899 | -0.1287R | -0.1074R | -0.0213 | 7% |
| 15 min | 194,681 | -0.0524R | -0.0661R | +0.0137 | 32% |
| 30 min | 226,043 | -0.0408R | -0.0323R | -0.0085 | 30% |
| 1 hour | 220,364 | -0.0318R | -0.0076R | -0.0242 | 32% |
| 4 hour | 103,780 | -0.0101R | -0.0187R | +0.0086 | 45% |
| Daily | 39,069 | +0.0034R | -0.0070R | +0.0104 | 53% |
On five- and fifteen-minute charts, all 55 indicators collectively added nothing over entering at random — a difference of 213 and 137 ten-thousandths of R across 735,580 trades.
The detail: five-minute: −0.1287R against random’s −0.1074R. Fifteen-minute: −0.0524R against −0.0661R. Those gaps are 213 and 137 ten-thousandths of R across hundreds of thousands of trades. 55 indicators, collectively, add nothing you could not get by flipping a coin.
And the gradient is not about indicators at all. Random entries show the same curve — from −0.107R on five minutes to −0.0070R on daily. So the improvement as the bar slows is not indicators working better. It is that a slower bar carries less cost and less noise per trade, and a coin flip benefits from that exactly as much as an indicator does.
An earlier version of this page presented the gradient on its own and read it as evidence about indicators. The control shows that reading was wrong, and it is left here rather than quietly corrected because the mistake is the useful part: a number with no baseline beside it will be over-interpreted, including by the person who produced it.
Where it gets interesting
On four-hour and daily charts the indicators start beating the control — by +0.0086R and +0.0104R respectively. Counted one indicator at a time rather than pooled, the picture is sharper still:
| Timeframe | Positive expectancy | Beat the random control |
|---|---|---|
| 5 min | 0 of 55 | 6 of 55 |
| 15 min | 0 of 55 | 38 of 55 |
| 30 min | 1 of 55 | 17 of 55 |
| 1 hour | 5 of 55 | 9 of 55 |
| 4 hour | 18 of 55 | 37 of 55 |
| Daily | 32 of 55 | 34 of 55 |
On five-minute charts 6 of 55 beat the control — about what chance alone produces from 55 coin flips. On four-hour charts 37 of 55 do, which chance does not produce easily.
But read the two columns together before getting excited. Beating the control is not the same as making money: on four-hour charts 37 of 55 still finish below zero. They lose less than a coin flip does, which is a real result and is not a profit. Daily is the strongest row in the table — 32 of 55 above zero — and it is also among the thinnest, with the fewest trades in the study.
Treat this as a hypothesis worth testing, not a conclusion. It is the most interesting result on the page and the least certain one, and those two things are related. The strategy tester runs the same engine if you want to push on it yourself.
What this means
- On fast charts there is no evidence of an indicator edge. Five- and fifteen-minute results are indistinguishable from random entries run through the same engine.
- The slower charts are the interesting part — and the least certain. On four-hour charts 37 of 55 indicators beat the control, on the smallest number of trades in the study. Interesting is not the same as proven.
- Win rate on its own tells you nothing about whether you make money. Several indicators here win most of their trades and still finish negative, because the losses are bigger than the wins.
- Costs decide fast trading. The spread is charged on every trade here, and on five-minute charts it is most of the result. Any backtest that leaves it out will look profitable and be wrong.
- Out-of-sample is the column to believe. It scores the last 30% of each window — data no setting was chosen against. Where it disagrees with the headline number, the headline is the one that is lying.
- No single indicator is a trading system. Nothing on this page was combined, filtered by session, or managed after entry. The first of those now has its own study: does making two indicators agree help? — every pair tested, each scored against the indicator that fires it.
How this was measured
Expectancy is the column that matters. A 70% win rate with a negative expectancy still loses money, and several indicators here manage exactly that. Profit factor and win rate are both easy to make look good by changing what counts as a trade; expectancy per trade is not.
Trade count is the credibility of the row. A profit factor of 3 from forty trades is noise wearing a suit. That is why the default filter is 200 trades and why thin rows are greyed rather than deleted — hiding them would be its own kind of dishonesty.
Entries fill at the next bar’s open, never the bar that produced the signal, and the stop is four median bars wide for that timeframe with the target at twice the stop. Scaling the stop to the bar is what makes the timeframes comparable: a fixed 20-pip stop is eight five-minute bars and less than one four-hour bar, so holding it constant measures the stop rather than the indicator.
It is not a ranking of which indicator to trade. Every one runs on its textbook settings — RSI 14, MACD 12/26/9, Bollinger 20/2 — and nothing else. Tuning each to its best parameters would produce a prettier table describing nothing but the tuning.
The full table
All 55 indicators, sortable. Click any name for that indicator’s own page and its per-timeframe breakdown.
| Indicator | Family | Trades | Expectancy (R) | Win rate | PF | PF out-of-sample | Runs profitable | 5 min | 15 min | 30 min | 1 hour | 4 hour | Daily |
|---|---|---|---|---|---|---|---|---|---|---|---|---|---|
| Volume oscillator | volume | 24,127 | -0.0504 | 37.0% | 0.97 | 1.03 | 32% | 0.90 | 1.03 | 1.05 | 1.00 | 0.93 | 1.26 |
| Bollinger reversion | volatility | 24,187 | -0.0514 | 36.8% | 0.99 | 0.99 | 42% | 0.90 | 0.84 | 0.78 | 0.97 | 1.12 | 1.36 |
| RSI 30/70 reversion | momentum | 17,629 | -0.0529 | 36.2% | 1.01 | 1.26 | 48% | 0.84 | 0.94 | 0.98 | 1.03 | 1.18 | 2.67 |
| Chande momentum | momentum | 21,979 | -0.0547 | 36.3% | 0.99 | 1.18 | 43% | 0.82 | 0.94 | 1.01 | 0.99 | 0.86 | 2.43 |
| Ultimate oscillator | momentum | 15,066 | -0.0548 | 35.9% | 1.04 | 1.10 | 41% | 0.83 | 1.01 | 1.10 | 1.09 | 0.88 | 1.73 |
| Momentum | momentum | 27,930 | -0.0570 | 36.8% | 0.99 | 1.05 | 34% | 0.86 | 0.89 | 1.11 | 1.09 | 1.10 | 1.27 |
| Heikin-Ashi flip | price action | 32,946 | -0.0586 | 36.4% | 0.95 | 1.00 | 39% | 0.86 | 0.93 | 1.02 | 1.06 | 1.02 | 1.11 |
| Williams %R | momentum | 30,048 | -0.0593 | 36.2% | 0.94 | 0.97 | 39% | 0.83 | 0.92 | 0.97 | 0.89 | 0.95 | 1.28 |
| Ichimoku TK cross | trend | 23,185 | -0.0602 | 36.4% | 0.99 | 0.99 | 38% | 0.88 | 0.89 | 1.11 | 0.83 | 1.17 | 1.08 |
| Vortex crossover | trend | 25,307 | -0.0607 | 36.6% | 0.99 | 1.11 | 41% | 0.85 | 0.87 | 1.09 | 1.13 | 1.31 | 1.39 |
| DEMA crossover | trend | 25,588 | -0.0610 | 36.6% | 1.00 | 1.16 | 36% | 0.86 | 0.95 | 1.17 | 1.04 | 1.11 | 1.83 |
| Force index | volume | 26,594 | -0.0612 | 36.5% | 0.98 | 1.02 | 39% | 0.83 | 0.92 | 1.06 | 1.05 | 1.09 | 1.14 |
| Relative vigour index | momentum | 35,249 | -0.0617 | 36.1% | 0.96 | 1.04 | 31% | 0.84 | 1.01 | 0.99 | 0.97 | 0.95 | 1.46 |
| Accumulation/distribution | volume | 27,152 | -0.0626 | 36.1% | 0.96 | 0.98 | 36% | 0.89 | 0.97 | 1.02 | 1.03 | 1.01 | 0.94 |
| Fisher transform | momentum | 35,689 | -0.0628 | 36.1% | 0.95 | 0.92 | 32% | 0.86 | 0.89 | 1.00 | 0.94 | 1.00 | 0.86 |
| CCI 100 | momentum | 26,762 | -0.0640 | 36.3% | 0.93 | 0.95 | 30% | 0.89 | 0.87 | 0.86 | 1.05 | 1.02 | 1.02 |
| Rate of change | momentum | 26,930 | -0.0646 | 36.3% | 0.96 | 1.03 | 33% | 0.83 | 0.90 | 1.02 | 0.98 | 1.05 | 1.37 |
| RSI 50 momentum | momentum | 23,489 | -0.0655 | 36.4% | 0.96 | 0.98 | 36% | 0.85 | 0.91 | 1.10 | 0.93 | 1.18 | 0.92 |
| Stochastic RSI | momentum | 31,345 | -0.0659 | 35.9% | 0.94 | 1.03 | 34% | 0.85 | 0.99 | 0.94 | 1.05 | 1.09 | 1.23 |
| Ease of movement | volume | 25,176 | -0.0660 | 36.6% | 0.98 | 0.99 | 33% | 0.82 | 0.89 | 1.15 | 1.04 | 1.14 | 0.94 |
| Parabolic SAR | trend | 28,595 | -0.0672 | 36.1% | 0.98 | 1.05 | 38% | 0.82 | 0.95 | 0.96 | 1.04 | 1.11 | 1.43 |
| VWMA vs SMA | volume | 24,899 | -0.0680 | 36.4% | 0.95 | 1.14 | 43% | 0.82 | 0.98 | 1.32 | 0.94 | 1.07 | 1.73 |
| Coppock curve | momentum | 23,241 | -0.0684 | 36.1% | 0.97 | 1.06 | 39% | 0.84 | 0.93 | 1.08 | 1.06 | 1.11 | 1.34 |
| Detrended price | momentum | 21,698 | -0.0692 | 36.4% | 0.96 | 1.02 | 34% | 0.80 | 0.97 | 1.21 | 0.96 | 1.10 | 1.11 |
| True strength index | momentum | 27,724 | -0.0700 | 36.1% | 0.96 | 1.10 | 29% | 0.84 | 0.91 | 1.02 | 1.02 | 1.13 | 1.65 |
| EMA crossover | trend | 18,298 | -0.0729 | 35.9% | 0.97 | 1.04 | 37% | 0.82 | 1.00 | 1.04 | 0.87 | 1.27 | 1.23 |
| MACD zero cross | momentum | 18,298 | -0.0729 | 35.9% | 0.97 | 1.04 | 37% | 0.82 | 1.00 | 1.04 | 0.87 | 1.27 | 1.23 |
| TEMA crossover | trend | 28,378 | -0.0733 | 35.9% | 0.94 | 0.96 | 28% | 0.88 | 0.92 | 0.93 | 0.93 | 1.12 | 1.01 |
| Aroon crossover | trend | 21,099 | -0.0733 | 36.1% | 0.97 | 1.24 | 33% | 0.87 | 1.00 | 1.16 | 0.77 | 1.14 | 2.47 |
| Awesome oscillator | momentum | 20,875 | -0.0735 | 36.1% | 0.97 | 1.21 | 32% | 0.83 | 1.00 | 1.22 | 0.89 | 1.18 | 2.11 |
| MACD signal cross | momentum | 27,580 | -0.0744 | 36.1% | 0.95 | 1.03 | 30% | 0.86 | 0.94 | 1.04 | 0.99 | 1.20 | 1.18 |
| KAMA crossover | trend | 26,563 | -0.0746 | 35.9% | 0.95 | 1.01 | 30% | 0.87 | 0.89 | 0.98 | 0.97 | 1.02 | 1.33 |
| TTM squeeze | volatility | 18,261 | -0.0761 | 36.1% | 0.96 | 1.00 | 38% | 0.86 | 1.02 | 0.98 | 0.96 | 1.18 | 1.01 |
| Least-squares MA | trend | 32,065 | -0.0767 | 35.8% | 0.96 | 0.99 | 32% | 0.83 | 0.88 | 0.94 | 0.91 | 1.03 | 1.33 |
| Stochastic | momentum | 26,424 | -0.0769 | 35.9% | 0.95 | 1.11 | 34% | 0.81 | 0.86 | 0.99 | 1.14 | 1.20 | 1.65 |
| OBV vs its average | volume | 27,814 | -0.0806 | 35.4% | 0.92 | 0.94 | 27% | 0.83 | 0.97 | 0.96 | 0.84 | 1.10 | 0.91 |
| TRIX zero cross | trend | 17,956 | -0.0808 | 35.6% | 0.98 | 1.13 | 39% | 0.77 | 1.00 | 1.11 | 0.85 | 1.23 | 1.81 |
| Hull MA crossover | trend | 27,762 | -0.0809 | 35.6% | 0.93 | 0.99 | 31% | 0.87 | 0.87 | 0.99 | 0.88 | 1.21 | 1.15 |
| Williams alligator | trend | 28,538 | -0.0815 | 35.3% | 0.91 | 0.97 | 28% | 0.88 | 0.95 | 0.93 | 0.90 | 1.12 | 1.04 |
| Money flow index | volume | 8,572 | -0.0818 | 35.1% | 1.02 | 1.70 | 33% | 0.99 | 0.94 | 0.85 | 0.85 | 4.98 | 1.51 |
| Elder ray | momentum | 26,791 | -0.0843 | 35.6% | 0.92 | 0.93 | 32% | 0.85 | 1.01 | 0.94 | 0.84 | 1.05 | 0.88 |
| Price vs SMA 200 | trend | 11,179 | -0.0844 | 34.9% | 1.00 | 1.38 | 40% | 0.78 | 1.14 | 0.92 | 1.23 | 2.94 | 1.27 |
| Donchian breakout | volatility | 26,998 | -0.0849 | 35.2% | 0.91 | 0.95 | 27% | 0.82 | 0.94 | 0.96 | 0.90 | 1.24 | 0.82 |
| Inside-bar breakout | price action | 26,835 | -0.0858 | 35.6% | 0.91 | 0.92 | 24% | 0.87 | 0.97 | 0.88 | 0.95 | 0.90 | 0.92 |
| ADX / DI crossover | trend | 10,839 | -0.0871 | 35.2% | 0.94 | 0.97 | 31% | 0.85 | 0.90 | 1.21 | 1.02 | 1.34 | 0.40 |
| Chaikin money flow | volume | 27,345 | -0.0876 | 35.2% | 0.92 | 1.02 | 21% | 0.86 | 0.95 | 0.91 | 1.07 | 1.26 | 1.08 |
| Engulfing candle | price action | 27,764 | -0.0880 | 35.2% | 0.92 | 0.91 | 28% | 0.83 | 0.99 | 0.96 | 0.84 | 1.03 | 0.79 |
| SuperTrend | trend | 18,661 | -0.0885 | 35.1% | 0.92 | 1.14 | 33% | 0.77 | 0.95 | 1.00 | 0.99 | 1.09 | 2.04 |
| Chaikin volatility | volatility | 23,138 | -0.0891 | 35.4% | 0.94 | 1.02 | 31% | 0.84 | 1.03 | 1.06 | 0.87 | 1.21 | 1.07 |
| SMA crossover | trend | 7,509 | -0.0897 | 34.6% | 1.02 | 0.83 | 36% | 0.77 | 0.86 | 0.80 | 0.99 | 0.91 | 0.60 |
| Pin bar | price action | 30,481 | -0.0926 | 35.1% | 0.89 | 0.90 | 19% | 0.80 | 0.95 | 0.87 | 0.88 | 0.96 | 0.91 |
| Bollinger breakout | volatility | 25,403 | -0.0933 | 35.0% | 0.90 | 0.96 | 23% | 0.84 | 0.98 | 1.01 | 0.85 | 1.09 | 0.97 |
| Keltner breakout | volatility | 22,143 | -0.1035 | 34.2% | 0.91 | 0.93 | 28% | 0.78 | 0.99 | 0.93 | 0.83 | 1.07 | 0.99 |
| Choppiness breakout | volatility | 18,864 | -0.1068 | 34.3% | 0.88 | 0.99 | 24% | 0.78 | 0.93 | 0.94 | 1.03 | 0.96 | 1.28 |
| ATR breakout | volatility | 19,868 | -0.1245 | 33.2% | 0.87 | 1.17 | 18% | 0.78 | 0.87 | 0.91 | 0.83 | 1.01 | 2.60 |
Take the data: download all 4,950 rows as CSV — free to reuse under CC BY 4.0, which asks only that you say where it came from.
The six right-hand columns are the out-of-sample profit factor on each timeframe — green above 1.00, red below. Rows greyed out have fewer than 200 trades and are shown but never ranked on.
Glossary
- R
- One unit of risk. +1R is a win the size of what you were risking; −1R is a full loss.
- Expectancy
- Average result per trade, in R. The number that decides whether a strategy makes money.
- Profit factor
- Gross profit divided by gross loss. Above 1.00 is profitable before costs of being wrong about it.
- Out-of-sample
- The last 30% of each window, scored separately. No setting was chosen against it.
- Random control
- Entries placed at random, run through the same engine, as a baseline for what no information looks like.
- Spread
- The dealing cost charged on every trade here, at the real per-instrument rate.
Then how does the signal service work?
A fair question, and the obvious one: if the laboratory says classic indicators do not clear their costs, why does the published record show what it shows?
Because this page tests something different. Every row above is a single indicator, alone, on its published settings, entering on every signal it gives, with a stop of four median bars and a target of twice that — in all market conditions, on all 15 instruments, forever. That is not how anybody trades, and it is not how our signals are produced. Ours combine several factors that must agree, decline far more setups than they take, and manage the trade after entry. Nothing on this page is a backtest of our signal engine, and it should not be read as one.
The one number that compares directly is expectancy, because it is in R either way:
| Measured over | Expectancy | Sample |
|---|---|---|
| Our published signals | +0.4240R | 1,031 trades, 5 months |
| Best single indicator here (Volume oscillator) | -0.0504R | 24,127 trades, up to 5 years |
| Random entries, same engine | -0.0076R | coin flip control |
The same standard, applied to us. Our record is 1,031 trades over about five months. The laboratory is 1,324,836 trades over up to five years — roughly 1285 times the sample. Every argument this page makes about small samples, out-of-sample testing and over-interpretation applies to our own results too, and the honest position is that five months is one market regime, not proof of an edge.
What we can say is narrower and checkable: every one of those trades was published before its outcome was known, the losses are still on the record, and the spread is deducted from the figure above exactly as it is from every row in this table. Judge it on that, and on how it looks in another year.
Citing this study
4,950 backtests of 55 indicators across 15 instruments and 6 timeframes, 1,324,836 trades, with the spread charged and a coin-flip control run through the same engine. The full dataset is downloadable and free to reuse under CC BY 4.0 — which asks only that you say where it came from.
Check it yourself
The strategy tester uses the same engine, the same candles and the same spread model. Pick any row that interests you, change one number, and watch what the out-of-sample column does — that is the fastest lesson in curve fitting available for free. The live record is where our own trades are published before their outcome is known, with the losses left in.
Want the setups, not just the maths?
Research is one thing and execution is another. The same discipline runs our published signals: entries filled at real prices, spread deducted, and every loss left on the record.
See today’s signals →