Does combining two indicators actually help?
The laboratory tests every indicator on its own and finds that almost none of them clear their costs. The obvious objection is that nobody trades one indicator alone. So this runs every pair of them: one indicator fires the entry, a second has to already agree, and the only question asked is whether the pair beats the first indicator by itself.
802 of 2878 pairs beat the indicator that fires them, when chance alone would give about 1439. Adding a second indicator helps less often than a coin toss.
But the ones that help tend to keep helping. Of the 802 winning pairs scored out of sample, 582 still beat their trigger on the last 30% of each window — data they were not selected on — where chance would leave about 401. Filtering is not free and it is not generally useful, and it is also not nothing.
What was tested
By timeframe
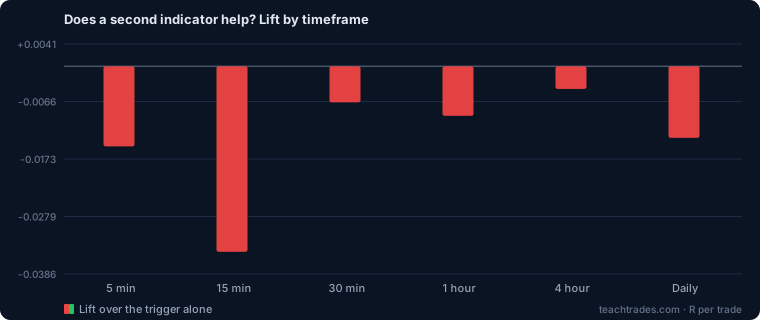
| Timeframe | Pairs tested | Average lift | Helped | Chance |
|---|---|---|---|---|
| 5 minute | 11,423 | −0.0149R | 41% | 50% |
| 15 minute | 11,012 | −0.0345R | 38% | 50% |
| 30 minute | 10,910 | −0.0067R | 45% | 50% |
| 1 hour | 10,912 | −0.0092R | 47% | 50% |
| 4 hour | 9,991 | −0.0042R | 49% | 50% |
| Daily | 1,991 | −0.0133R | 47% | 50% |
“Helped” is the share of pairs on that timeframe where the filter beat the trigger alone. A filter that did nothing at all would land near 50%, which is the column beside it.
Why this page distrusts its own table
Running 2,878 pairs guarantees winners. If every filter were pure noise, about 1439 of them would still beat their trigger, some by a wide margin, and the top of any ranking would look compelling. That is not a flaw in the test, it is arithmetic, and it is the reason most published indicator combinations are worthless: somebody searched until something looked good and then stopped.
So the column that decides anything is the last one. Every window has its final 30% scored separately, and a pair is only interesting if it still beats its trigger there. 582 of 802 did, against roughly 401 expected from chance. That gap is real and it is the one result on this page worth acting on.
One caveat we cannot test away. The out-of-sample third is the most recent third, so it sits next to the data it is being compared against. A filter that suits one market regime can survive the split simply because the regime did. Treat the survivors as worth investigating, not as settled.
What separates the filters that work
Not which indicators they are. How much they refuse. Splitting every pair by the share of the trigger's own entries the filter let through:
| The filter let through | Pairs | Helped the trigger | Distance from chance |
|---|---|---|---|
| Under 30% of entries | 112 | 49% | -0.2σ |
| 70% or more of entries | 2,276 | 27% | -22.3σ |
A filter that agrees with almost everything is worse than no filter. The 2,276 pairs that let through 70% or more of the trigger's entries helped only 27% of the time — 22 standard deviations below a coin toss, so this is not noise. An indicator that rarely disagrees adds its own lag and its own cost and contributes no information, and that describes most of the pairs in this study.
The selective end looks better, and the sample is too small to bank it. The 112 pairs rejecting more than 70% of entries helped 49% of the time, which sounds decisive and is only 0.2 standard deviations from chance on 112 pairs. Selective filters also produce fewer trades, and fewer trades means noisier estimates in both directions. It is the most promising thing on this page and it is not yet a result.
What the two rows together do say, with more confidence than any individual pair in the table: if a second indicator is going to earn its place, it earns it by declining setups, not by nodding along.
Every pair, ranked by lift
Pairs with at least 300 trades, best first. Read the last two columns together: a large lift with a negative out-of-sample lift is a pair that worked until it was asked to prove it.
| Trigger | Filter | Trades | Kept | Trigger alone | Filtered | Lift | Lift out of sample |
|---|---|---|---|---|---|---|---|
| Keltner breakout | Stochastic RSI | 393 | 17% | −0.1426R | +0.0672R | +0.2098R | +0.2439R |
| CCI 100 | Momentum | 305 | 11% | −0.1115R | +0.0446R | +0.1561R | −0.2366R |
| Bollinger reversion | DEMA crossover | 1,414 | 25% | −0.0221R | +0.1277R | +0.1499R | +0.1753R |
| Bollinger reversion | Fisher transform | 321 | 13% | −0.0684R | +0.0638R | +0.1321R | +0.1712R |
| Bollinger reversion | True strength index | 378 | 16% | −0.0715R | +0.0565R | +0.1280R | +0.0917R |
| Bollinger reversion | Stochastic | 321 | 13% | −0.0724R | +0.0550R | +0.1274R | −0.0638R |
| RSI 30/70 reversion | Engulfing candle | 762 | 26% | −0.0178R | +0.1060R | +0.1238R | +0.1459R |
| SuperTrend | Williams %R | 325 | 17% | −0.0799R | +0.0363R | +0.1162R | +0.0960R |
| CCI 100 | MACD signal cross | 2,351 | 35% | −0.0554R | +0.0583R | +0.1137R | +0.1063R |
| Donchian breakout | Stochastic RSI | 437 | 16% | −0.0694R | +0.0434R | +0.1127R | +0.2707R |
| RSI 30/70 reversion | Chaikin money flow | 399 | 21% | −0.0314R | +0.0789R | +0.1103R | +0.0459R |
| CCI 100 | DEMA crossover | 2,842 | 42% | −0.0496R | +0.0575R | +0.1072R | +0.0799R |
| Ultimate oscillator | Heikin-Ashi flip | 550 | 31% | −0.0218R | +0.0796R | +0.1014R | −0.0026R |
| Choppiness breakout | Bollinger reversion | 538 | 25% | −0.1622R | −0.0658R | +0.0964R | +0.1797R |
| Bollinger breakout | RSI 30/70 reversion | 4,020 | 61% | −0.0741R | +0.0142R | +0.0884R | +0.0379R |
| RSI 30/70 reversion | TRIX zero cross | 333 | 17% | −0.0280R | +0.0598R | +0.0878R | +0.1407R |
| CCI 100 | True strength index | 2,197 | 35% | −0.0528R | +0.0319R | +0.0846R | +0.0571R |
| RSI 30/70 reversion | VWMA vs SMA | 1,472 | 39% | −0.0056R | +0.0752R | +0.0808R | +0.0998R |
| CCI 100 | Stochastic | 1,023 | 20% | −0.0656R | +0.0132R | +0.0789R | +0.0209R |
| CCI 100 | Hull MA crossover | 4,210 | 61% | −0.0462R | +0.0321R | +0.0782R | +0.0669R |
| ATR breakout | Stochastic RSI | 1,029 | 30% | −0.1522R | −0.0765R | +0.0757R | +0.0854R |
| Choppiness breakout | RSI 30/70 reversion | 1,944 | 44% | −0.1083R | −0.0328R | +0.0755R | +0.0902R |
| Pin bar | RSI 30/70 reversion | 3,497 | 44% | −0.0824R | −0.0081R | +0.0744R | +0.0229R |
| TTM squeeze | RSI 30/70 reversion | 2,911 | 62% | −0.0748R | −0.0011R | +0.0737R | +0.0663R |
| Williams alligator | RSI 30/70 reversion | 5,349 | 73% | −0.0670R | +0.0035R | +0.0705R | +0.0585R |
| Hull MA crossover | RSI 30/70 reversion | 6,231 | 88% | −0.0661R | +0.0022R | +0.0683R | +0.0462R |
| CCI 100 | Rate of change | 309 | 11% | −0.1128R | −0.0483R | +0.0645R | +0.0037R |
| Bollinger reversion | OBV vs its average | 1,500 | 27% | −0.0218R | +0.0419R | +0.0637R | +0.0248R |
| Donchian breakout | RSI 30/70 reversion | 4,051 | 59% | −0.0524R | +0.0100R | +0.0624R | +0.0421R |
| OBV vs its average | RSI 30/70 reversion | 6,645 | 94% | −0.0732R | −0.0122R | +0.0609R | +0.0619R |
| RSI 30/70 reversion | Hull MA crossover | 805 | 27% | −0.0162R | +0.0445R | +0.0607R | +0.0328R |
| ATR breakout | RSI 30/70 reversion | 2,774 | 57% | −0.1186R | −0.0614R | +0.0572R | −0.0090R |
| Chaikin money flow | RSI 30/70 reversion | 5,267 | 75% | −0.0633R | −0.0060R | +0.0572R | +0.0324R |
| Ultimate oscillator | VWMA vs SMA | 1,249 | 46% | −0.0232R | +0.0330R | +0.0562R | +0.0050R |
| MACD signal cross | Stochastic RSI | 3,336 | 46% | −0.0595R | −0.0048R | +0.0547R | +0.0388R |
| Choppiness breakout | Chande momentum | 1,400 | 33% | −0.1157R | −0.0611R | +0.0546R | +0.0020R |
| Hull MA crossover | Williams %R | 5,848 | 82% | −0.0662R | −0.0118R | +0.0543R | +0.0399R |
| Bollinger reversion | Ease of movement | 339 | 19% | −0.0354R | +0.0181R | +0.0535R | −0.0813R |
| Chaikin volatility | RSI 30/70 reversion | 3,517 | 60% | −0.0747R | −0.0219R | +0.0528R | +0.0401R |
| Price vs SMA 200 | Chande momentum | 2,057 | 79% | −0.0458R | +0.0066R | +0.0524R | +0.0512R |
| Williams %R | MACD signal cross | 3,395 | 43% | −0.0192R | +0.0329R | +0.0520R | +0.0952R |
| OBV vs its average | Bollinger reversion | 6,726 | 95% | −0.0734R | −0.0218R | +0.0516R | +0.0650R |
| Hull MA crossover | Volume oscillator | 5,314 | 74% | −0.0669R | −0.0159R | +0.0510R | +0.0541R |
| Williams alligator | CCI 100 | 3,680 | 49% | −0.0677R | −0.0173R | +0.0504R | +0.0134R |
| SMA crossover | Stochastic RSI | 475 | 54% | −0.0670R | −0.0170R | +0.0499R | +0.0810R |
| ATR breakout | CCI 100 | 2,138 | 45% | −0.1266R | −0.0767R | +0.0499R | +0.0080R |
| Hull MA crossover | Stochastic RSI | 1,778 | 27% | −0.0679R | −0.0191R | +0.0488R | +0.0220R |
| Bollinger reversion | Accumulation/distribution | 1,244 | 24% | −0.0330R | +0.0158R | +0.0488R | +0.0592R |
| Volume oscillator | RSI 30/70 reversion | 4,166 | 68% | −0.0365R | +0.0118R | +0.0483R | +0.0185R |
| Hull MA crossover | Bollinger reversion | 6,351 | 90% | −0.0660R | −0.0179R | +0.0481R | +0.0424R |
| Bollinger reversion | MACD signal cross | 469 | 18% | −0.0544R | −0.0071R | +0.0473R | +0.0416R |
| MACD signal cross | RSI 30/70 reversion | 6,474 | 92% | −0.0571R | −0.0103R | +0.0468R | +0.0066R |
| Chaikin volatility | Williams %R | 2,471 | 42% | −0.0789R | −0.0324R | +0.0465R | +0.0460R |
| ATR breakout | TRIX zero cross | 3,486 | 70% | −0.1156R | −0.0693R | +0.0463R | +0.0851R |
| Bollinger reversion | Hull MA crossover | 2,644 | 44% | −0.0188R | +0.0273R | +0.0461R | +0.1029R |
| Williams %R | True strength index | 3,326 | 42% | −0.0192R | +0.0259R | +0.0450R | +0.0713R |
| Price vs SMA 200 | CCI 100 | 1,851 | 70% | −0.0473R | −0.0024R | +0.0449R | +0.0420R |
| MACD signal cross | Bollinger reversion | 6,613 | 94% | −0.0571R | −0.0124R | +0.0448R | +0.0281R |
| CCI 100 | Vortex crossover | 409 | 15% | −0.1128R | −0.0685R | +0.0442R | +0.1206R |
| ATR breakout | Chande momentum | 2,909 | 60% | −0.1187R | −0.0754R | +0.0433R | −0.0417R |
| Price vs SMA 200 | RSI 30/70 reversion | 2,160 | 82% | −0.0461R | −0.0032R | +0.0429R | +0.0483R |
| Bollinger breakout | Chande momentum | 3,861 | 58% | −0.0742R | −0.0312R | +0.0429R | +0.0129R |
| Williams alligator | Bollinger reversion | 4,701 | 64% | −0.0672R | −0.0245R | +0.0427R | +0.0397R |
| TTM squeeze | Chande momentum | 2,704 | 59% | −0.0737R | −0.0310R | +0.0427R | +0.0025R |
| Ultimate oscillator | Fisher transform | 1,729 | 52% | −0.0245R | +0.0179R | +0.0424R | +0.0244R |
| Money flow index | ADX / DI crossover | 544 | 50% | −0.0572R | −0.0150R | +0.0422R | +0.0746R |
| Bollinger reversion | RSI 30/70 reversion | 4,822 | 78% | −0.0168R | +0.0253R | +0.0421R | +0.0272R |
| Money flow index | Inside-bar breakout | 317 | 32% | −0.0595R | −0.0176R | +0.0420R | −0.0715R |
| VWMA vs SMA | RSI 30/70 reversion | 5,417 | 88% | −0.0309R | +0.0110R | +0.0419R | +0.0374R |
| CCI 100 | TEMA crossover | 3,455 | 49% | −0.0483R | −0.0065R | +0.0418R | +0.0206R |
| Price vs SMA 200 | Stochastic RSI | 1,725 | 65% | −0.0467R | −0.0051R | +0.0416R | +0.0809R |
| VWMA vs SMA | Williams %R | 5,030 | 82% | −0.0315R | +0.0101R | +0.0415R | +0.0137R |
| DEMA crossover | Stochastic RSI | 1,868 | 31% | −0.0275R | +0.0132R | +0.0408R | +0.0691R |
| Ultimate oscillator | Least-squares MA | 840 | 40% | −0.0276R | +0.0131R | +0.0407R | −0.0366R |
| Hull MA crossover | Chande momentum | 6,405 | 90% | −0.0661R | −0.0255R | +0.0406R | +0.0475R |
| ATR breakout | Williams %R | 1,853 | 39% | −0.1277R | −0.0872R | +0.0405R | −0.0049R |
| MACD signal cross | CCI 100 | 6,676 | 95% | −0.0571R | −0.0170R | +0.0401R | +0.0236R |
| ATR breakout | Pin bar | 3,383 | 67% | −0.1166R | −0.0767R | +0.0399R | +0.0875R |
| Chande momentum | Inside-bar breakout | 2,890 | 51% | −0.0286R | +0.0112R | +0.0398R | −0.0157R |
| ATR breakout | Accumulation/distribution | 4,310 | 88% | −0.1137R | −0.0739R | +0.0398R | +0.0646R |
| Hull MA crossover | CCI 100 | 6,331 | 89% | −0.0662R | −0.0269R | +0.0393R | +0.0465R |
| CCI 100 | RSI 30/70 reversion | 5,446 | 80% | −0.0444R | −0.0053R | +0.0391R | +0.0103R |
| CCI 100 | Least-squares MA | 1,874 | 29% | −0.0558R | −0.0167R | +0.0391R | +0.0227R |
| ATR breakout | Engulfing candle | 3,697 | 75% | −0.1148R | −0.0761R | +0.0387R | +0.0894R |
| Keltner breakout | RSI 30/70 reversion | 2,163 | 42% | −0.0965R | −0.0579R | +0.0386R | +0.0053R |
| Bollinger reversion | TEMA crossover | 1,548 | 27% | −0.0217R | +0.0165R | +0.0382R | +0.0361R |
| Chaikin money flow | DEMA crossover | 6,036 | 86% | −0.0631R | −0.0250R | +0.0381R | +0.0320R |
| OBV vs its average | CCI 100 | 6,711 | 95% | −0.0733R | −0.0357R | +0.0377R | +0.0445R |
| MACD signal cross | Williams %R | 6,404 | 91% | −0.0570R | −0.0199R | +0.0371R | +0.0421R |
| Chande momentum | TEMA crossover | 916 | 22% | −0.0384R | −0.0019R | +0.0365R | +0.0697R |
| ATR breakout | VWMA vs SMA | 4,066 | 83% | −0.1145R | −0.0780R | +0.0364R | +0.0773R |
| Ultimate oscillator | RSI 30/70 reversion | 2,826 | 81% | −0.0265R | +0.0097R | +0.0362R | +0.0212R |
| True strength index | Williams %R | 6,414 | 90% | −0.0391R | −0.0032R | +0.0360R | +0.0163R |
| DEMA crossover | Williams %R | 5,185 | 80% | −0.0228R | +0.0132R | +0.0359R | +0.0631R |
| ATR breakout | Williams alligator | 3,380 | 68% | −0.1152R | −0.0792R | +0.0359R | +0.0687R |
| Chaikin money flow | Chande momentum | 5,144 | 73% | −0.0630R | −0.0275R | +0.0355R | +0.0065R |
| Elder ray | RSI 30/70 reversion | 4,412 | 64% | −0.0643R | −0.0292R | +0.0351R | +0.0442R |
| Choppiness breakout | VWMA vs SMA | 3,456 | 74% | −0.0955R | −0.0604R | +0.0351R | +0.0504R |
| MACD signal cross | Inside-bar breakout | 5,572 | 79% | −0.0576R | −0.0225R | +0.0350R | +0.0196R |
| ATR breakout | Choppiness breakout | 3,729 | 75% | −0.1153R | −0.0803R | +0.0350R | +0.0706R |
| ATR breakout | Volume oscillator | 3,695 | 75% | −0.1162R | −0.0812R | +0.0350R | +0.0404R |
| Inside-bar breakout | CCI 100 | 5,316 | 75% | −0.0380R | −0.0034R | +0.0346R | +0.0671R |
| TTM squeeze | VWMA vs SMA | 3,729 | 78% | −0.0680R | −0.0336R | +0.0344R | +0.0144R |
| Least-squares MA | RSI 30/70 reversion | 7,917 | 93% | −0.0518R | −0.0177R | +0.0341R | +0.0084R |
| True strength index | Stochastic RSI | 3,151 | 43% | −0.0399R | −0.0060R | +0.0339R | +0.0030R |
| ATR breakout | Ichimoku TK cross | 3,651 | 74% | −0.1147R | −0.0811R | +0.0336R | +0.0598R |
| SMA crossover | VWMA vs SMA | 710 | 70% | −0.0845R | −0.0512R | +0.0333R | −0.0312R |
| Least-squares MA | Bollinger reversion | 8,073 | 95% | −0.0518R | −0.0191R | +0.0327R | +0.0193R |
| Engulfing candle | RSI 30/70 reversion | 3,419 | 47% | −0.0531R | −0.0205R | +0.0327R | +0.0004R |
| Coppock curve | Williams alligator | 642 | 21% | −0.0409R | −0.0084R | +0.0325R | +0.0525R |
| SuperTrend | RSI 30/70 reversion | 3,993 | 86% | −0.0369R | −0.0045R | +0.0324R | +0.0250R |
| Price vs SMA 200 | Accumulation/distribution | 2,497 | 95% | −0.0459R | −0.0137R | +0.0322R | +0.0538R |
| ATR breakout | Bollinger reversion | 2,105 | 44% | −0.1275R | −0.0954R | +0.0321R | −0.0351R |
| CCI 100 | Accumulation/distribution | 2,815 | 40% | −0.0475R | −0.0158R | +0.0318R | −0.0246R |
| Hull MA crossover | OBV vs its average | 5,620 | 78% | −0.0676R | −0.0359R | +0.0317R | +0.0647R |
| Chande momentum | RSI 30/70 reversion | 4,517 | 80% | −0.0300R | +0.0017R | +0.0317R | +0.0299R |
| ATR breakout | Chaikin money flow | 3,752 | 75% | −0.1139R | −0.0822R | +0.0317R | +0.0815R |
| ATR breakout | Inside-bar breakout | 3,529 | 71% | −0.1160R | −0.0844R | +0.0316R | +0.0308R |
| RSI 30/70 reversion | Williams alligator | 1,184 | 31% | −0.0017R | +0.0295R | +0.0312R | −0.0655R |
| MACD signal cross | Chande momentum | 6,625 | 95% | −0.0571R | −0.0262R | +0.0309R | +0.0250R |
| Williams alligator | Chande momentum | 5,050 | 68% | −0.0671R | −0.0364R | +0.0308R | +0.0072R |
| True strength index | CCI 100 | 6,753 | 96% | −0.0393R | −0.0088R | +0.0305R | +0.0105R |
| Bollinger breakout | Stochastic RSI | 300 | 11% | −0.1200R | −0.0896R | +0.0304R | +0.3213R |
| CCI 100 | Williams alligator | 5,037 | 74% | −0.0443R | −0.0143R | +0.0300R | −0.0297R |
| True strength index | Bollinger reversion | 6,726 | 95% | −0.0392R | −0.0092R | +0.0300R | +0.0129R |
| RSI 30/70 reversion | Price vs SMA 200 | 354 | 18% | −0.0293R | +0.0006R | +0.0299R | −0.0016R |
| Relative vigour index | Bollinger reversion | 8,936 | 96% | −0.0365R | −0.0069R | +0.0296R | +0.0313R |
| OBV vs its average | Stochastic RSI | 6,162 | 87% | −0.0737R | −0.0442R | +0.0295R | +0.0278R |
| TEMA crossover | Bollinger reversion | 6,811 | 93% | −0.0282R | +0.0011R | +0.0292R | −0.0071R |
| ATR breakout | OBV vs its average | 3,969 | 80% | −0.1153R | −0.0861R | +0.0292R | +0.0599R |
| MACD signal cross | DEMA crossover | 4,234 | 59% | −0.0588R | −0.0298R | +0.0290R | +0.0210R |
| OBV vs its average | Inside-bar breakout | 6,474 | 92% | −0.0732R | −0.0444R | +0.0288R | +0.0085R |
| CCI 100 | OBV vs its average | 2,748 | 41% | −0.0441R | −0.0155R | +0.0286R | −0.0671R |
| Bollinger breakout | Volume oscillator | 5,028 | 78% | −0.0732R | −0.0446R | +0.0286R | +0.0389R |
| ATR breakout | Coppock curve | 3,767 | 76% | −0.1158R | −0.0873R | +0.0285R | +0.0456R |
| Chaikin volatility | Stochastic RSI | 1,860 | 34% | −0.0799R | −0.0513R | +0.0285R | +0.0177R |
| Relative vigour index | RSI 30/70 reversion | 8,851 | 95% | −0.0359R | −0.0077R | +0.0282R | −0.0050R |
| Hull MA crossover | Inside-bar breakout | 5,485 | 77% | −0.0666R | −0.0386R | +0.0281R | +0.0213R |
| ATR breakout | EMA crossover | 3,893 | 78% | −0.1154R | −0.0873R | +0.0281R | +0.0751R |
| ATR breakout | MACD zero cross | 3,893 | 78% | −0.1154R | −0.0873R | +0.0281R | +0.0751R |
| Hull MA crossover | Relative vigour index | 6,664 | 94% | −0.0671R | −0.0391R | +0.0280R | +0.0243R |
| Chande momentum | Fisher transform | 2,121 | 41% | −0.0310R | −0.0031R | +0.0279R | +0.0837R |
| OBV vs its average | Chande momentum | 6,767 | 96% | −0.0733R | −0.0454R | +0.0279R | +0.0373R |
| True strength index | DEMA crossover | 4,408 | 61% | −0.0393R | −0.0114R | +0.0279R | +0.0325R |
| Hull MA crossover | DEMA crossover | 5,027 | 70% | −0.0678R | −0.0399R | +0.0278R | +0.0317R |
| Parabolic SAR | RSI 30/70 reversion | 6,938 | 93% | −0.0427R | −0.0150R | +0.0277R | +0.0257R |
| Stochastic RSI | RSI 30/70 reversion | 6,288 | 75% | −0.0239R | +0.0037R | +0.0276R | −0.0142R |
| TEMA crossover | RSI 30/70 reversion | 6,603 | 90% | −0.0281R | −0.0006R | +0.0274R | −0.0191R |
| OBV vs its average | Least-squares MA | 6,828 | 97% | −0.0731R | −0.0460R | +0.0271R | +0.0385R |
| Fisher transform | Bollinger reversion | 9,208 | 97% | −0.0435R | −0.0166R | +0.0269R | +0.0423R |
| True strength index | RSI 30/70 reversion | 6,562 | 92% | −0.0392R | −0.0124R | +0.0268R | −0.0010R |
| Chande momentum | Chaikin money flow | 1,736 | 33% | −0.0323R | −0.0057R | +0.0266R | −0.0216R |
| Inside-bar breakout | Bollinger reversion | 5,374 | 76% | −0.0378R | −0.0112R | +0.0266R | +0.0661R |
| TEMA crossover | Williams %R | 6,811 | 93% | −0.0282R | −0.0018R | +0.0264R | +0.0086R |
| Stochastic RSI | MACD signal cross | 5,941 | 72% | −0.0269R | −0.0007R | +0.0263R | −0.0028R |
| ATR breakout | Awesome oscillator | 3,669 | 74% | −0.1158R | −0.0896R | +0.0263R | +0.0593R |
| OBV vs its average | MACD signal cross | 6,416 | 91% | −0.0734R | −0.0470R | +0.0263R | +0.0203R |
| Ichimoku TK cross | DEMA crossover | 5,753 | 97% | −0.0320R | −0.0061R | +0.0259R | +0.0378R |
| Choppiness breakout | Inside-bar breakout | 3,457 | 74% | −0.0961R | −0.0703R | +0.0258R | +0.0309R |
| SMA crossover | Relative vigour index | 462 | 53% | −0.0614R | −0.0357R | +0.0257R | +0.0195R |
| OBV vs its average | Hull MA crossover | 6,216 | 88% | −0.0739R | −0.0485R | +0.0255R | +0.0284R |
| ATR breakout | Vortex crossover | 4,209 | 85% | −0.1150R | −0.0898R | +0.0253R | +0.0438R |
| Hull MA crossover | Money flow index | 6,048 | 85% | −0.0665R | −0.0413R | +0.0252R | +0.0152R |
| Parabolic SAR | MACD signal cross | 5,927 | 78% | −0.0431R | −0.0179R | +0.0252R | +0.0142R |
| Stochastic | True strength index | 6,401 | 95% | −0.0401R | −0.0149R | +0.0252R | +0.0420R |
| Aroon crossover | MACD signal cross | 5,213 | 97% | −0.0260R | −0.0009R | +0.0251R | +0.0264R |
| OBV vs its average | Williams %R | 6,559 | 93% | −0.0734R | −0.0487R | +0.0247R | +0.0171R |
| Choppiness breakout | Money flow index | 2,586 | 56% | −0.1036R | −0.0790R | +0.0246R | −0.0481R |
| DEMA crossover | RSI 30/70 reversion | 5,963 | 91% | −0.0230R | +0.0015R | +0.0245R | +0.0196R |
| ATR breakout | DEMA crossover | 4,110 | 83% | −0.1150R | −0.0905R | +0.0245R | +0.0315R |
| RSI 30/70 reversion | TEMA crossover | 879 | 26% | −0.0050R | +0.0192R | +0.0243R | +0.1038R |
| Least-squares MA | Volume oscillator | 7,186 | 84% | −0.0522R | −0.0279R | +0.0243R | +0.0122R |
| OBV vs its average | Money flow index | 6,590 | 93% | −0.0736R | −0.0494R | +0.0242R | +0.0211R |
| ATR breakout | Bollinger breakout | 4,226 | 86% | −0.1148R | −0.0907R | +0.0241R | +0.0621R |
| VWMA vs SMA | Stochastic RSI | 4,805 | 77% | −0.0331R | −0.0091R | +0.0241R | −0.0249R |
| Hull MA crossover | VWMA vs SMA | 5,239 | 73% | −0.0667R | −0.0427R | +0.0240R | +0.0753R |
| VWMA vs SMA | Bollinger reversion | 5,256 | 85% | −0.0306R | −0.0068R | +0.0238R | +0.0249R |
| OBV vs its average | Chaikin money flow | 6,146 | 87% | −0.0732R | −0.0497R | +0.0236R | +0.0457R |
| Hull MA crossover | Accumulation/distribution | 5,600 | 78% | −0.0678R | −0.0443R | +0.0235R | +0.0263R |
| Chande momentum | Volume oscillator | 3,018 | 54% | −0.0308R | −0.0074R | +0.0234R | +0.0104R |
| Aroon crossover | Williams %R | 1,906 | 38% | −0.0287R | −0.0054R | +0.0232R | −0.0795R |
| Stochastic | RSI 30/70 reversion | 6,303 | 94% | −0.0404R | −0.0173R | +0.0231R | +0.0090R |
| Ultimate oscillator | Bollinger reversion | 3,212 | 92% | −0.0266R | −0.0035R | +0.0231R | +0.0078R |
| Inside-bar breakout | RSI 30/70 reversion | 5,325 | 74% | −0.0380R | −0.0149R | +0.0231R | +0.0433R |
| OBV vs its average | Accumulation/distribution | 6,548 | 93% | −0.0733R | −0.0504R | +0.0229R | +0.0113R |
| Chaikin volatility | Chaikin money flow | 4,719 | 80% | −0.0745R | −0.0516R | +0.0229R | +0.0244R |
| Ichimoku TK cross | MACD signal cross | 5,812 | 98% | −0.0320R | −0.0093R | +0.0227R | +0.0215R |
| Least-squares MA | Chande momentum | 8,030 | 94% | −0.0517R | −0.0291R | +0.0226R | +0.0354R |
| KAMA crossover | RSI 30/70 reversion | 6,631 | 97% | −0.0516R | −0.0292R | +0.0224R | +0.0188R |
| SMA crossover | Coppock curve | 1,312 | 79% | −0.0728R | −0.0504R | +0.0223R | −0.0192R |
| CCI 100 | Chaikin money flow | 4,466 | 65% | −0.0456R | −0.0235R | +0.0221R | +0.0373R |
| Relative vigour index | CCI 100 | 8,945 | 96% | −0.0363R | −0.0142R | +0.0221R | +0.0194R |
| Hull MA crossover | TTM squeeze | 5,130 | 71% | −0.0678R | −0.0462R | +0.0216R | +0.0358R |
| Price vs SMA 200 | Chaikin money flow | 2,373 | 90% | −0.0466R | −0.0251R | +0.0215R | +0.0079R |
| Chaikin money flow | MACD signal cross | 6,077 | 87% | −0.0630R | −0.0416R | +0.0215R | −0.0059R |
| TEMA crossover | Stochastic RSI | 4,833 | 66% | −0.0281R | −0.0067R | +0.0214R | +0.0560R |
| ATR breakout | Aroon crossover | 4,058 | 82% | −0.1152R | −0.0938R | +0.0214R | +0.0594R |
| TTM squeeze | Chaikin money flow | 3,958 | 81% | −0.0708R | −0.0494R | +0.0214R | +0.0390R |
| TEMA crossover | CCI 100 | 6,926 | 95% | −0.0283R | −0.0070R | +0.0213R | −0.0116R |
| MACD signal cross | Williams alligator | 3,533 | 49% | −0.0596R | −0.0383R | +0.0213R | +0.0783R |
Take the data: download all 56,239 rows as CSV — free to reuse under CC BY 4.0, which asks only that you say where it came from.
“Kept” is the share of the trigger's own entries that survived the filter. A filter keeping 95% of them is barely a filter; one keeping 20% is a different strategy wearing the trigger's name.
Citing this study
56,239 backtests of 2,878 indicator pairs over 14,326,491 trades, each pair scored against the indicator that fires it rather than against zero. The full dataset is downloadable and free to reuse under CC BY 4.0 — which asks only that you say where it came from.
How this was measured
The filter is not required to fire on the same candle as the trigger. Crossovers are rare, and asking two of them to land on the same bar would test coincidence rather than agreement. What a trader means by “the filter agrees” is the indicator's standing opinion — its most recent signal — and that is what is used.
The pairing is asymmetric on purpose. “Enter on RSI, but only while the trend indicator agrees” is a different rule from the reverse, and both appear in the table separately.
Everything else matches the single-indicator laboratory: published settings, entries at the next bar's open, the stop four median bars wide with the target at twice it, the real per-pair spread charged on every trade, and the last 30% of each window scored separately. Pairs taking fewer than 60 trades on a chart are not recorded at all.
It runs on 4 instruments rather than the laboratory's fifteen, because 2,878 pairs on six timeframes is already 56,239 backtests. The instruments are a major, a second major, a yen major and the most volatile cross we carry, so a result that holds on one and fails on the rest is visible in the table.
Want the setups, not just the maths?
Our own signals are not a pair of indicators either - they combine several factors that must agree and decline far more setups than they take. The difference is on the public record, with the losses left in.
See today’s signals →