Which hours of the day actually make money
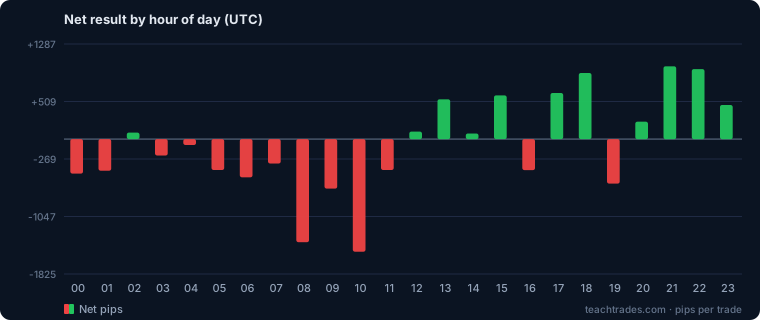
Every hour tested separately, everything else held constant. Only 11 of the 24 hours finished in front — and the gap between the best and the worst is far larger than the gap between most strategies.
By session
| Session | Hours (UTC) | Trades | Win rate | Net pips |
|---|---|---|---|---|
| Asia | 00:00–06:59 | 4,846 | 37.4% | -2,041 |
| London morning | 07:00–11:59 | 3,137 | 35.6% | -4,339 |
| London / New York overlap | 12:00–16:59 | 3,188 | 38.7% | +890 |
| New York afternoon | 17:00–20:59 | 2,315 | 39.1% | +1,152 |
| Late / rollover | 21:00–23:59 | 2,211 | 40.3% | +2,397 |
This is the useful cut. A single hour is a thin sample and will happily tell you that 03:00 is magic; a session pools enough trades to be worth acting on.
Every hour
| Hour (UTC) | Trades | Win rate | Profit factor | Net pips |
|---|---|---|---|---|
| 00:00 | 860 | 36.5% | 0.95 | -466 |
| 01:00 | 686 | 37.3% | 0.95 | -427 |
| 02:00 | 573 | 39.3% | 1.01 | +88 |
| 03:00 | 605 | 37.4% | 0.97 | -222 |
| 04:00 | 595 | 38.3% | 0.99 | -80 |
| 05:00 | 723 | 37.1% | 0.95 | -418 |
| 06:00 | 804 | 36.9% | 0.95 | -517 |
| 07:00 | 703 | 37.0% | 0.96 | -330 |
| 08:00 | 649 | 34.1% | 0.83 | -1,396 |
| 09:00 | 530 | 37.9% | 0.89 | -670 |
| 10:00 | 596 | 33.2% | 0.8 | -1,524 |
| 11:00 | 659 | 35.8% | 0.95 | -419 |
| 12:00 | 832 | 38.0% | 1.01 | +102 |
| 13:00 | 644 | 39.9% | 1.08 | +539 |
| 14:00 | 633 | 38.5% | 1.01 | +77 |
| 15:00 | 581 | 39.6% | 1.09 | +592 |
| 16:00 | 498 | 37.6% | 0.93 | -420 |
| 17:00 | 565 | 40.7% | 1.1 | +624 |
| 18:00 | 572 | 40.6% | 1.14 | +894 |
| 19:00 | 606 | 36.8% | 0.92 | -602 |
| 20:00 | 572 | 38.6% | 1.03 | +236 |
| 21:00 | 691 | 42.0% | 1.13 | +986 |
| 22:00 | 801 | 40.3% | 1.11 | +948 |
| 23:00 | 719 | 38.7% | 1.06 | +462 |
What stands out
Best hours by net pips: 21:00 (+986), 22:00 (+948), 18:00 (+894). Worst: 10:00 (-1,524), 08:00 (-1,396), 09:00 (-670).
The pooled total across all hours is -1,941 pips, which is the honest headline: these are textbook strategies and they lose money overall. The point of the table is not that some hour is profitable in isolation — it is how much of the damage is concentrated, and how little of the day is carrying the result.
This contradicts the usual advice, and one reason is our own fault
Every trading course tells you to trade the London open and avoid the quiet hours. This table says the opposite: the London morning block is the worst of the five, and the late session is the best.
Before anyone rearranges their day around that, here is the most likely explanation — and it is a flaw in the test, not a discovery.
Our spread is a constant. The backtest charges each pair a fixed typical spread at every hour. Real spreads do not work that way: they widen sharply around the daily rollover, which is exactly the block that comes out best here. The session our test likes most is the session where our cost model is most optimistic. Some of that +2,397 pips is money a real account would have paid to the spread and never seen.
The strategies also have a bias. Two of the three tested are mean-reverting. Quiet hours suit mean reversion and punish trend following; the volatile London open does the reverse. A table built from trend-following strategies alone could easily invert this result, which means what you are looking at is partly a fact about these strategies rather than about the clock.
The other caveats
An hour filter is a parameter like any other. Pick the best three hours from this table, backtest only those, and you will get a beautiful curve that means nothing — you chose them because they were best in this sample. That is curve fitting with extra steps, and it is why our tester reports the last 30% of every window separately.
Six months is one seasonal cycle. Session behaviour shifts with volatility regimes, central bank calendars and daylight saving. A table built on a different six months would not look identical.
What probably does generalise is narrower than the table: your strategy has a volatility regime it prefers, the hour of day is a rough proxy for that regime, and the pairing between the two is worth knowing for your strategy. Not "trade at 21:00".
Test your own hours
The strategy tester has an hour filter — select the hours you actually trade, on the pair you actually trade, and see what your own window looks like rather than the average of everyone’s.
Want the setups, not just the maths?
Our signals carry their timestamps, so you can check for yourself which sessions our record is actually built on.
See today’s signals →